
Images and paintings have been used to depict a story since cavemen walked the earth. They used drawings to show where wild animals would roam. Where to avoid and where to hunt for food. Although quite rudimental in there styling and technique, cave paintings do all have a similar feeling to them. This is mainly because of how the paint was produced and applied to the walls, but I am sure there are similarities seen across a number of different locations. Does this mean there were art movements even in caveman times?
The egyptians employed iconography, in a similar way to words, to portray things in every day life.
Icon use has now made a comeback and forms part of the emoji systems on phones and other technical devices.
The Bayeux Tapestry, which is almost 70 meters long and 50cm wide, is almost like a modern day comic strip where the reader is taken on a visual journey from left to right.
Each of these endeavours was created in a bid to successfully tell a story. We mainly use words today, but at their peak, some of these methods could have been more explicit and clear in the message they were providing.
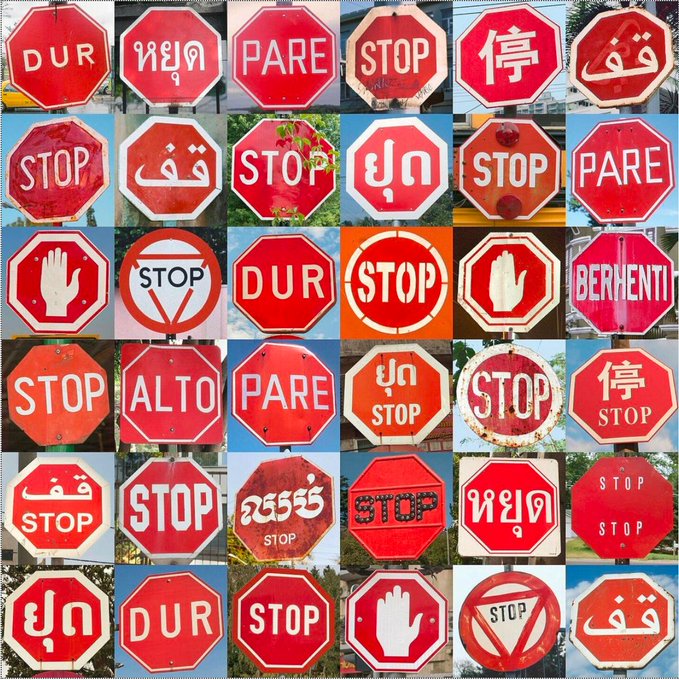
Icons and symbols are still very much part of today’s society and a set of ‘rules’ have been applied globally to ensure easy reading which negates lanuage.
The red hexagon to the left seen at the roadside will automatically make the driver want to stop. As you can see from the above image, this shape and colour has been adopted by a number of countries as a sign to stop.
There is a place for universal ‘language’ and one that helps us as communicators to ensure messages are recieved.
The Design Museum recently relocated to Kensington and the design agency Cartlidge Levene was tasked with creating a simple navigation system for the building.
The typography is clear and the icons have been scaled up to create eye catching wall reliefs,adding a dynamic touch to what could have been a bland system.
They kept it simple because that’s when design is at its best. Antoine de Saint-Expery said ‘A designer knows he has achieved perfection not when there is nothing left to add, but when there is nothing left
to take away.’
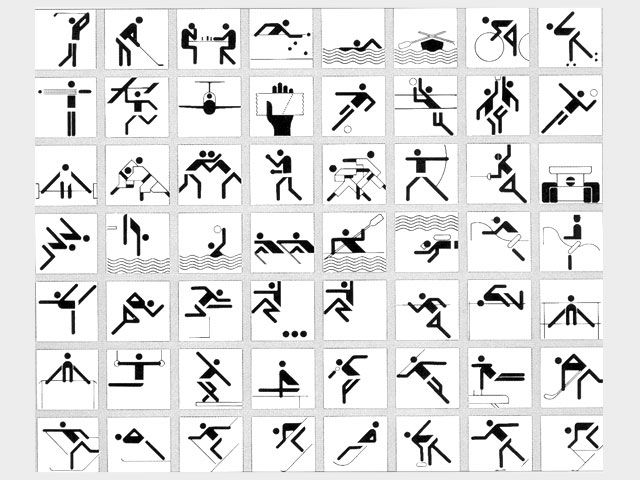
This sentiment was carried through the way-finding of The Design Museum by Cartlidge Levene’s choice to use Otl Aicher’s famous icon suite for navigation, which was designed in 1972 for the Munich Olympics.
This is not the first time Aicher’s icons have been used since 1972, there are now over 700 pictograms in the range and new ones are constantly being created.
He was originally inspired by the angles of the new buildings designed for the Olympics and created a simple grid system to base all the icons on, adding colour to the designs in application to add more energy and vibrancy. The original set has been a major
influence on icons around the world.
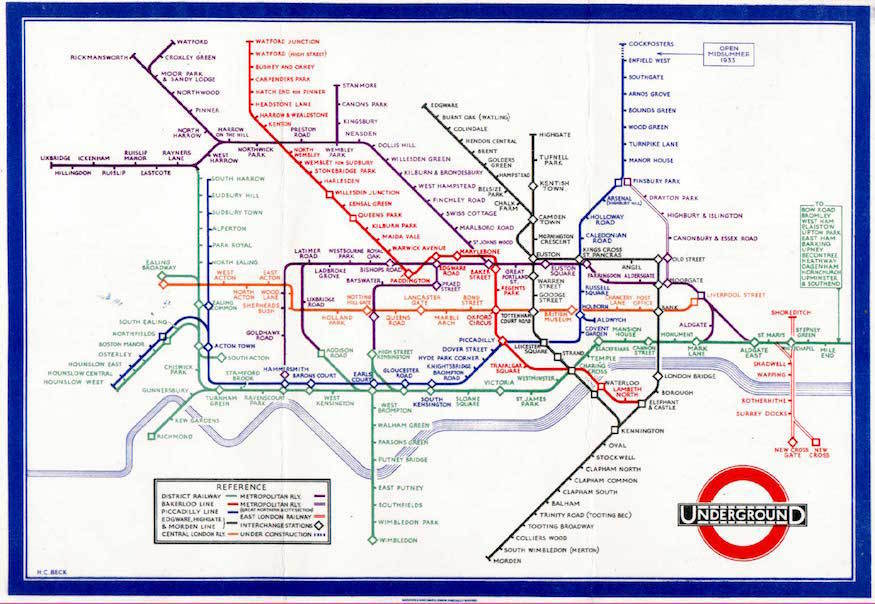
Another example of how date has been compressed and simplified is that of the London Underground. Henry Beck updated the cluttered topogrphical map with one that was simpler and easier to read.
It wasn’t accurate in terms of distances or location and was considered quite radical at the time.
The map was rejected initially because of this, but after a successful trial period the map was fully adpoted.
The map, with modeifications and additions, still exists today and serves millions of customers every year.
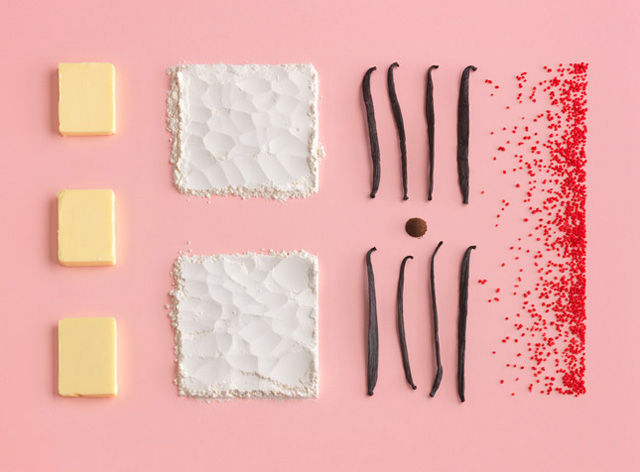

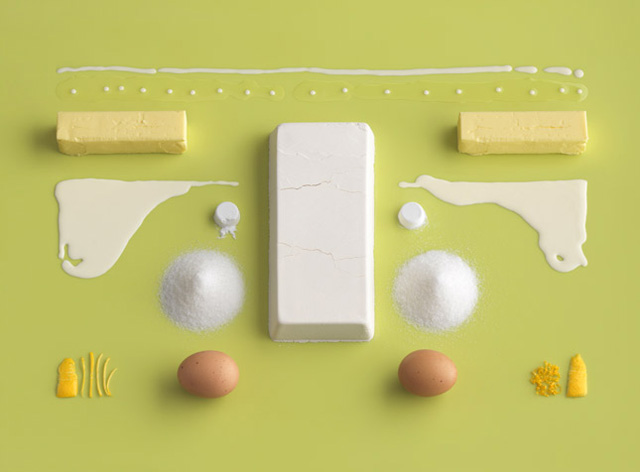
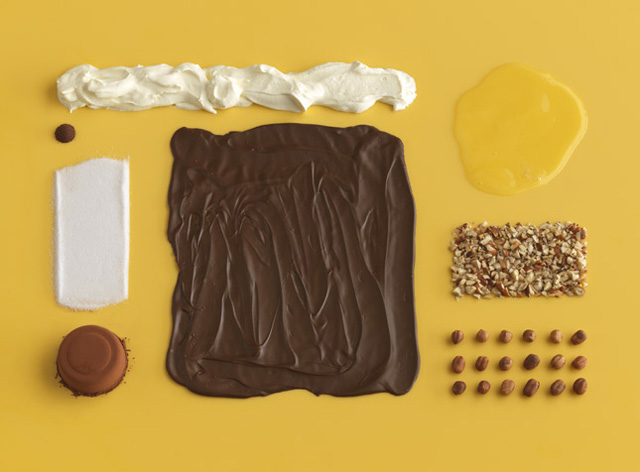
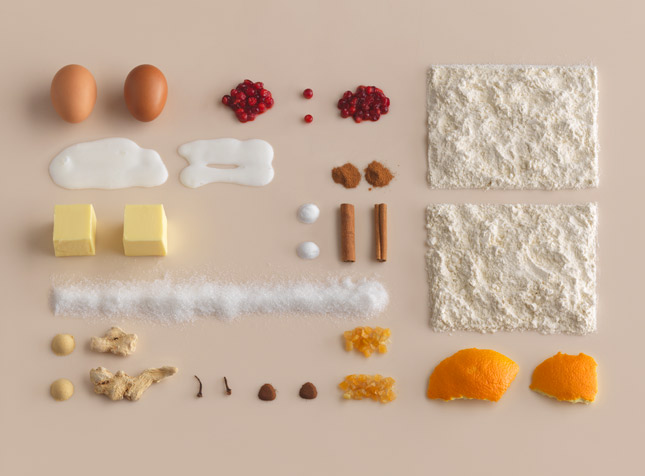

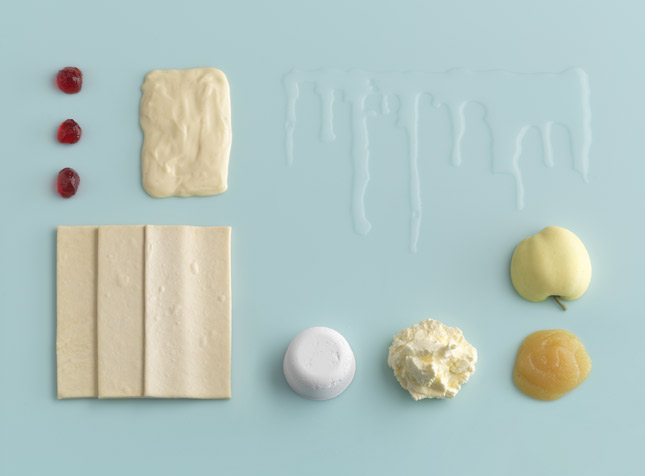
Information and data can be visualised without words and still retain its intent. IKEA created a cookbook where the ingredients were laid out on the page with no words.
By definition, graphic design is the combination of words and images. With the lack of words this leaves me with a mind boggling question – Is this art? Does the inference of words still mean it is design?
Personally, I have to think of this as design. Someone has taken the time to arrane these elements carefully in a way that is easily readble.
I dont think their intention was to create something to be hung in a gallery. Rather, an illustrative tool explaining to the users in the simplest terms on how to cook.
Incidently, the cook book itself follows the IKEA brand. They have continued their flat pack approach and have then applied it to cooking.
It would be really interesting to see if they have applied this technique elsewhere – maybe a date night? or a football game?
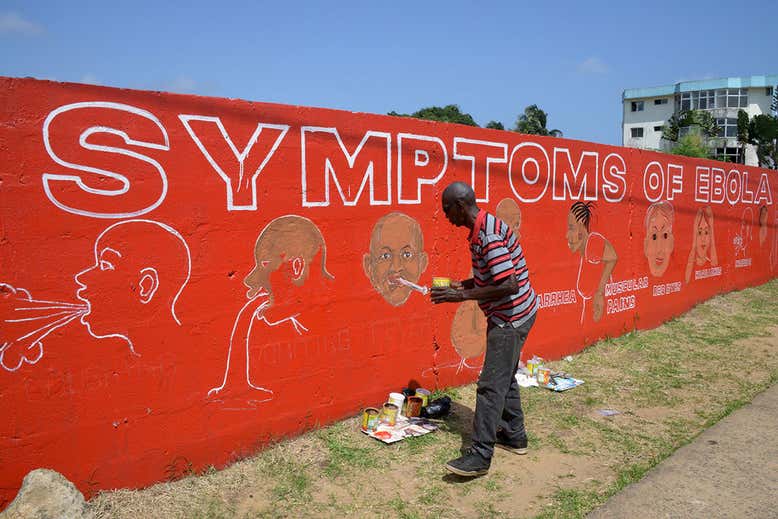
Design employed in the right circumstances can be life saving. Whether it be aids or smoking, it has been proven that good design can be so powerful it can change behaviour.
“During the 2014 Ebola epidemic in West Africa, Liberian designer Stephen Doe painted walls red to show danger and used simple iconography to convey the disease’s symptoms to a population among whom more than 30 languages were spoken – and few people could read or write.”

Infographics are saving lives today. The government has used many infographics aiding their explanation of the Covid-19 Pandemic.
They are relatively easy to understand and the public can gain understanding with just a glance.
The government has also extended this easy read approach to their strapline of ,”hands, space and face”. By using icons to represent these three important elements, it is hoped the campaign will be understood by a wider and diverse section of society.
I think that is what is so appealing about infographics. They appeal and are readable by many people, negate language and provide a standardised way of delivering information.
Workshop Challenge
This week we want you to analyse one of the pre-selected examples downloadof information design to determine its effectiveness. Consider clarity, communication, message and the role of design in communicating the message to you. Be critical and write a synopsis about its effectiveness, which we want you to present as a piece for editorial design.
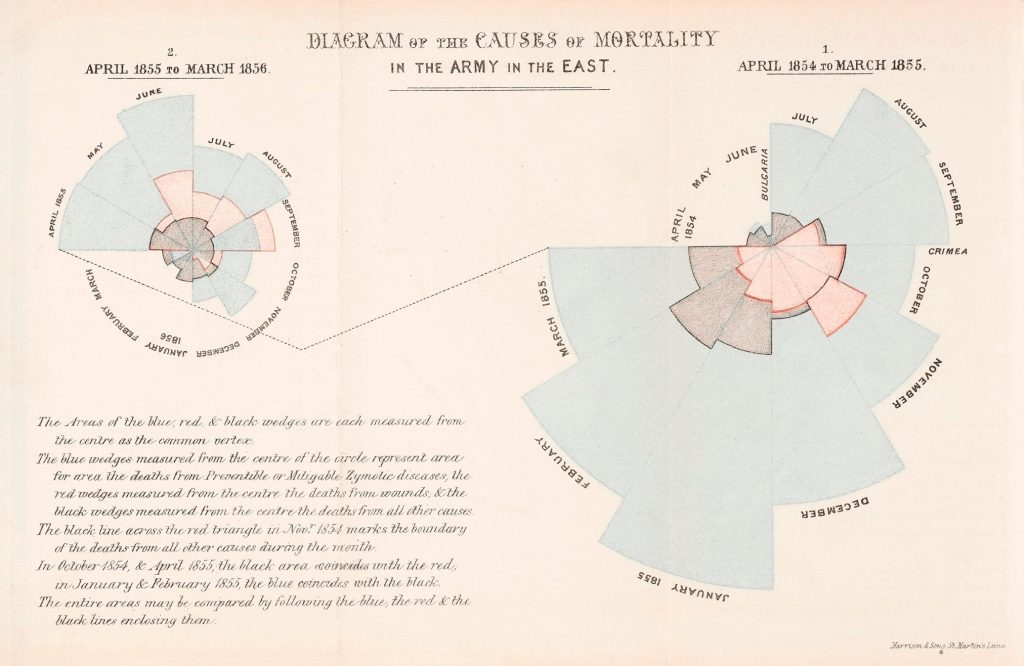
The purpose of Florence Nightingale’s ‘Deaths From Disease’ Rose Diagram (1855) was to highlight the level of deaths attributed to preventable infections and disease rather than war inflicted wounds. This data was compiled during Nightingale’s time helping those at battle in the Crimean War.
The diagram itself does not focus on numerical data but instead uses design to highlight the empirical disparity of those dying when they need not. What I have taken from observing this diagram is that it feels as though Nightingale is leading you to a conclusion, commenting on the situation without explicitly concluding anything. It important to bear in mind the political and social time period in which the views of women would have not been acknowledged. Nightingale, understanding this, has tactically spoke in the form of a diagram which is unequivocally clear to any. It may not be wrong to argue or assume that Nightingale sees her place as a collector and presenter of data, and in a way, hopes that the conclusions which can be drawn, are universally understood and accepted.
Data is a gender and class neutral tool which when displayed effectively and appropriately is undisputable.
While the diagram succeeds in highlighting the deaths from preventable diseases, it is not refined in its exactness. There are no figures, scale or point of reference that allows the reader to take reference or measure from. The text supplied with the diagram, in contrast, is cumbersome, unclear and takes away the readers attention. A simple blue, red, black key would have negated the attention transference and kept the point of focus on the diagram.
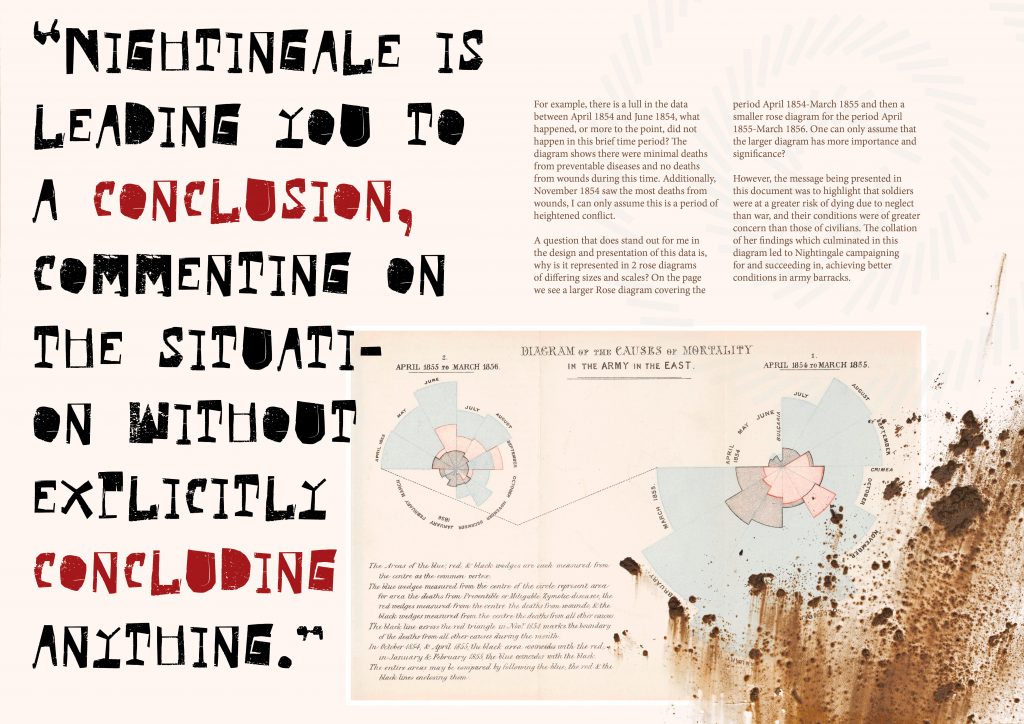
The data presented is very relevant to its time period, those reading it at the time would have the knowledge of ‘the present’ whereas reading now, there are many questions that, as an uneducated historian, arise. For example, there is a lull in the data between April 1854 and June 1854, what happened, or more to the point, did not happen in this brief time period? The diagram shows there were minimal deaths from preventable diseases and no deaths from wounds during this time. Additionally, November 1854 saw the most deaths from wounds, I can only assume this is a period of heightened conflict.
A question that does stand out for me in the design and presentation of this data is, why is it represented in 2 rose diagrams of differing sizes and scales? On the page we see a larger Rose diagram covering the period April 1854-March 1855 and then a smaller rose diagram for the period April 1855-March 1856. One can only assume that the larger diagram has more importance and significance?
However, the message being presented in this document was to highlight that soldiers were at a greater risk of dying due to neglect than war, and their conditions were of greater concern than those of civilians. The collation of her findings which culminated in this diagram led to Nightingale campaigning for and succeeding in, achieving better conditions in army barracks.
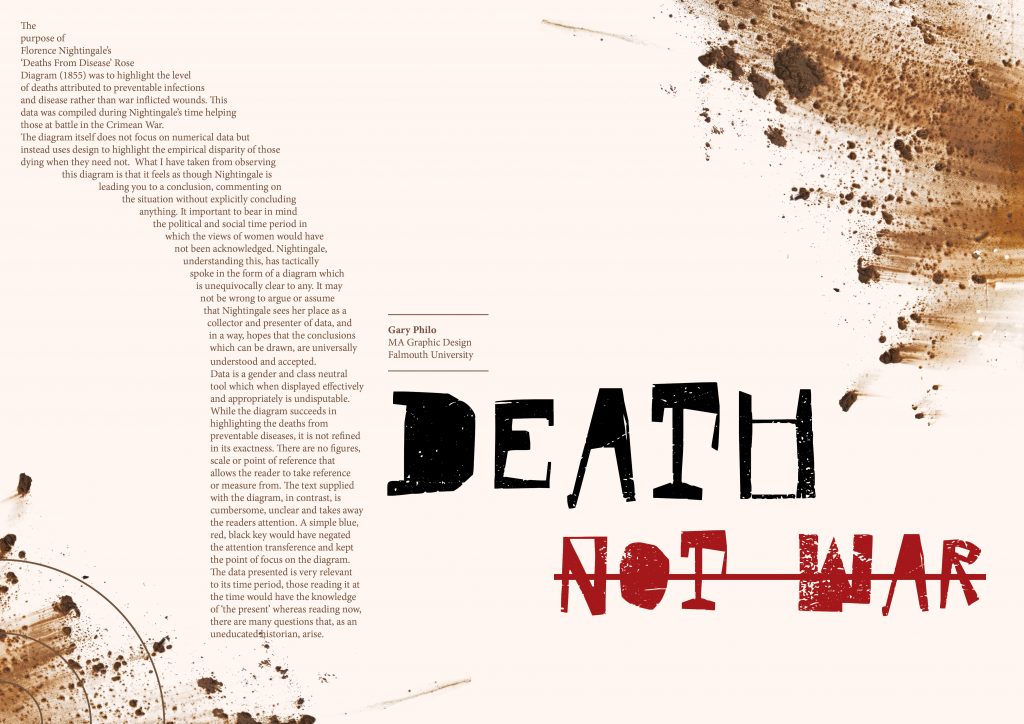
I wanted to create a visual design which highlighted the fact that people were dying from other means and not war.
War is an explosive environment, but bloodhshed from fighting was not the leading cause of death. I wanted to capture the feeling of this explosive environment and used a spraying dirt effect, similiar to that of a gun blast. The conditions surrounding the war were causing deaths and I hope these ‘gunshot dirt effects’ draws a link between the two.
I decided to use a rudimental, hand made typeface in this design as it felt like it portrayed a similar feeling to that of war – Jagged, rushed, macabre, dark.
As a secondary nod to the dark side of war, I also created a cover and back cover which were completely black except for a spot UV varnish over the title on the cover.

References
Chatterton, S., 2021. What the Lascaux Cave Paintings Tell Us About the Nature of Human Desire. [online] Medium. Available at: https://medium.com/@stevechatterton/what-the-lascaux-cave-paintings-tell-us-about-the-nature-of-human-desire-4c8d06deef83 [Accessed 14 May 2021].
Donvour, A., 2021. Hieroglyphics Language: The History of Ancient Egypt. [online] Medium. Available at: https://medium.com/@alex.dovr00/hieroglyphics-language-the-history-of-ancient-egypt-5a6385185952 [Accessed 14 May 2021].
Walsh, S., 2021. Emojis in Email Subject Lines: Do They Affect Open Rates? [DATA]. [online] Search Engine Journal. Available at: https://www.searchenginejournal.com/emojis-in-subject-lines/378280/ [Accessed 14 May 2021].
Schwartz, O., 2021. Bayeux Tapestry | History Of The Antique Bayeux Tapestry. [online] Nazmiyal Antique Rugs. Available at: https://nazmiyalantiquerugs.com/blog/bayeux-tapestry/ [Accessed 14 May 2021].
Litten, T., 2021. @troylitten. [online] Instagram. Available at: https://www.instagram.com/p/CImHuDHHK9U/ [Accessed 14 May 2021].
Levene, C., 2021. The Design Museum – Wayfinding and signage – Cartlidge Levene. [online] Cartlidgelevene.co.uk. Available at: https://cartlidgelevene.co.uk/work/the-design-museum-wayfinding-and-signage [Accessed 14 May 2021].
Greynotgrey.com. 2021. [online] Available at: http://greynotgrey.com/blog/wp-content/uploads/2012/05/otl-aicher.jpg [Accessed 14 May 2021].
Matters, T., 2021. Harry Beck’s Tube map. [online] Transport for London. Available at: https://tfl.gov.uk/corporate/about-tfl/culture-and-heritage/art-and-design/harry-becks-tube-map [Accessed 14 May 2021].
TwistedSifter. 2010. Brilliant Visual Recipes by IKEA [22 pics]. [online] Available at: https://twistedsifter.com/2010/09/visual-recipes-ikea-carl-kleiner/ [Accessed 14 May 2021].
Lange, C., 2017. Graphic design can save your life – here’s how. [online] New Scientist. Available at: https://www.newscientist.com/article/2147303-graphic-design-can-save-your-life-heres-how/ [Accessed 14 May 2021].
GOV.UK. 2021. Weekly COVID-19 surveillance report published. [online] Available at: https://www.gov.uk/government/news/weekly-covid-19-surveillance-report-published [Accessed 14 May 2021].
Biography. 2020. How Florence Nightingale’s Hygiene Crusade Saved Millions. [online] Available at: https://www.biography.com/news/florence-nightingale-hygiene-handwashing [Accessed 14 May 2021].
Leave a Reply